Shoprite

Check(ers) Mate

Shoprite, South Africa’s largest retailer, released its 2024 full-year results last week. The company reported total revenue of R240.7 billion, reflecting a 12% increase year-over-year. Their trading profit also saw an increase of 12.4%, reaching R13.4 billion, which translates into a trading margin of 5.5% for the year. Shoprite’s gross profit rose by 11.7% to R57.8 billion, resulting in a gross margin of 24.0% for the year. 

Shoprite has been expanding. They have been continuously striving to capture a larger and larger share of the retail market. Since 2021, the group has increased its number of stores by 25.7%, reaching a total of 3,639 outlets. Their Xtra savings loyalty card membership has also surged by 10.7 million members since 2021 to 31 million members at the end of their 2024 financial year. This has greatly aided their data-driven AI strategy to better understand and serve their customers. The expansion and insights have resulted in their sales growing by 43% compared to the 2021 levels.  

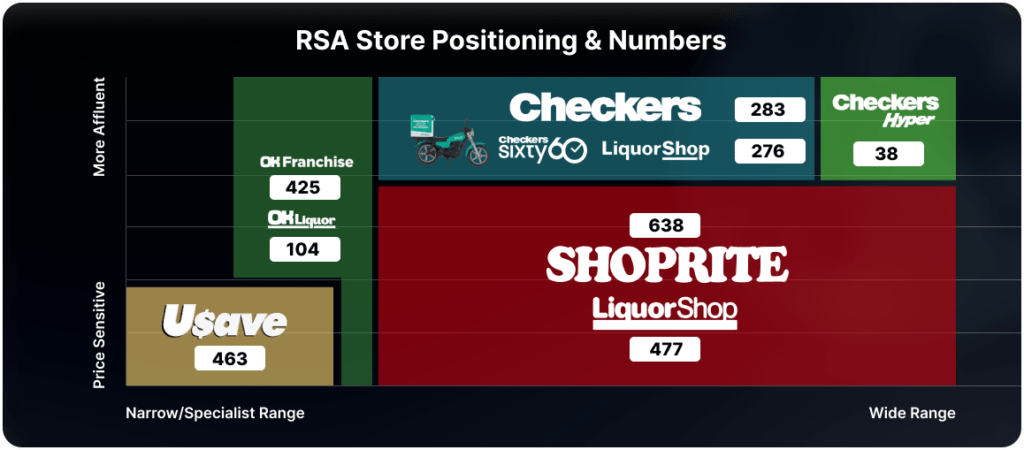
The brands under Shoprite’s umbrella include Shoprite, Usave, Checkers, Uniq, Medirite, and others. Shoprite caters to both affluent and low-income customers and is present in rural and urban areas alike. The graph below illustrates how Shoprite perceives its brands and their positioning in South Africa. Notably, last year, Checkers, Shoprite’s premium brand which yields slightly higher margins, was the fastest growing brand in the premium supermarket space. The growth was fuelled by the success of their delivery service Checkers Sixty60. 

RSA Store Positioning and Numbers

Source: https://www.shopriteholdings.co.za/docs/results-presentation-2024.pdf

Shoprite employs a hub-and-spoke model. When establishing a supermarket like Shoprite or Checkers in a new area, they subsequently set up other branded stores nearby, such as their pharmacy chain Medirite or clothing store Uniq, creating a complementary shopping ecosystem that attracts customers to these auxiliary outlets. 

Last week, Shoprite’s share price fell by just over 3%, amid market expectations for slightly stronger results. Shoprite trades at a price-to-earnings (PE) ratio of around 24, which is higher than Pick ‘n Pay’s PE ratio of -11 (due to major write-offs) and Woolworths’ (Woollies) PE ratio of 18. This indicates the premium investors are willing to pay to hold Shoprite shares.  

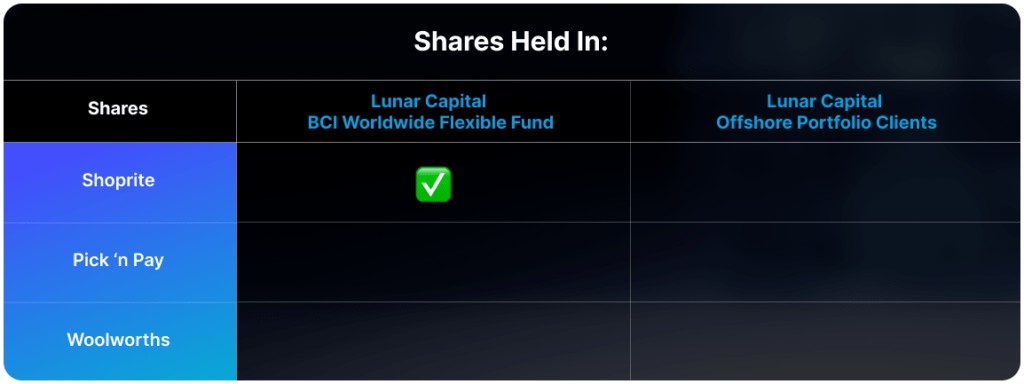
Shares Held In
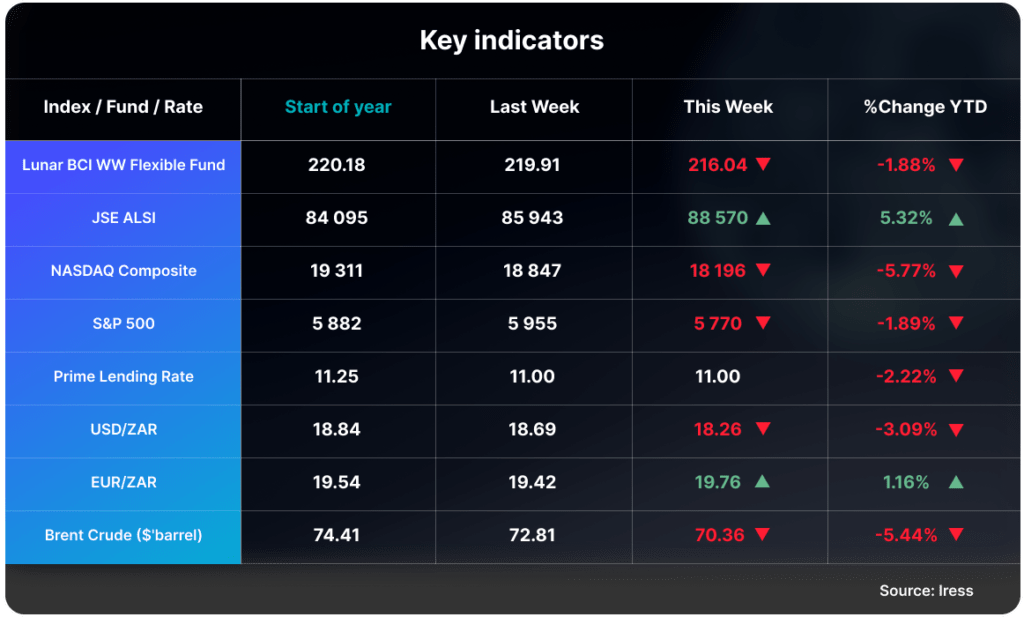
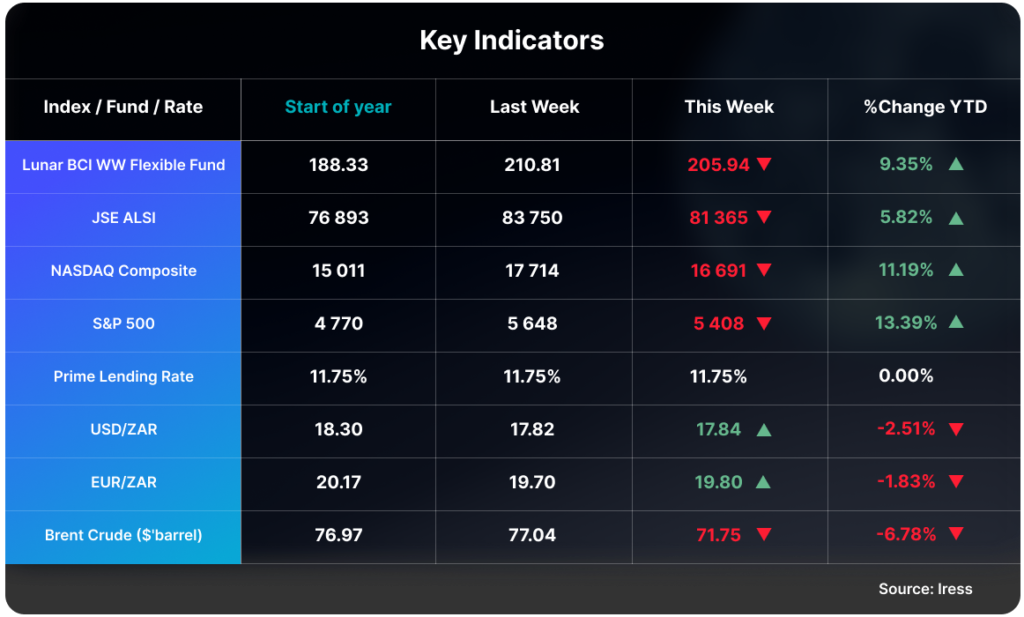
Key Indicators

Click here to access your account to view statements, obtain tax certificates, add or make changes to your investments.

Our email address is: [email protected]

Disclosures
Lunar Capital (Pty) Ltd is a registered Financial Services Provider. FSP (46567)
Read our full Disclosure statement: https://lunarcapital.co.za/disclosures/
Our Privacy Notice: https://lunarcapital.co.za/privacy-policy/
The Lunar BCI Worldwide Flexible Fund Fact Sheet  can be read here.
This stocktake is prepared for the clients of Lunar Capital (Pty) Ltd. This stocktake does not constitute financial advice and is generated for information purposes only.

Check(ers) Mate Read More »

Shoprite-aholics

Shoprite-aholics

Companies striving for growth in a sluggish economy face formidable challenges when trying to grow, particularly those operating as supermarket retailers with an already large presence in the country. Another way for expansion involves gaining market share from competitors, a strategy used by Shoprite, South Africa’s largest supermarket retailer. Shoprite’s strength comes from the some of the following attributes:

  1.  They boast an established portfolio of brands, each uniquely tailored to appeal to distinct customer segments. The Usave, Shoprite, and Checkers brands cater to specific markets based on customer income levels and range of products sold.
  2. Shoprite employs a centralized distribution model, leveraging large distribution centers around the country. This strategic approach enables them to maintain high stock levels in their stores while simultaneously managing costs. Their stores will also hold products with similar levels of quality.
  3. Shoprite distinguishes itself by predominantly owning and controlling its stores, in contrast to competitors like Pick ‘n Pay and Spar, which have a higher reliance on franchise outlets. This ownership structure allows Shoprite to swiftly implement business changes and ensures a superior level of consistency compared to its competitors.
  4. Shoprite also employs AI to do its purchasing from its suppliers. Shoprite had a 98% in-stock levels for the period. Shoprite are able to maintain a high in-stock levels, while still keeping their prices low, partially because of this.

Last week, Shoprite released their H1 2024 results. Revenue for the business increased by 13.9% to reach R121.1bn for the period. Excluding the revenue growth attributable to the acquisition of Massmart stores, Shoprite’s supermarket segment grew by 11.2%. While Gross Profit increased by 14.7% to R28.6bn, representing a 23.6% gross margin. Trading profit for the period increased by 10.7% to R6.7bn.

One of the standout metrics was Checkers Sixty60. Its revenue has grown by more than 60%. The app is leading more customers to the Checkers brand, resulting in market share growth. Checkers also use their stores as mini distribution centers, which means they don’t have to build and create new distribution centers for the Sixty60 purpose. Pieter Englebrecht, the CEO, has said these are the reasons this segment in profitable.

The supermarket retail arena is fiercely competitive, with customers primarily prioritizing price and product availability. Supermarkets operate within a framework of relatively low gross and net margins, making them highly susceptible to shifts in costs. Their path to profitability predominantly hinges on scaling their business to achieve higher sales volumes while concurrently maintaining consistent operating costs.

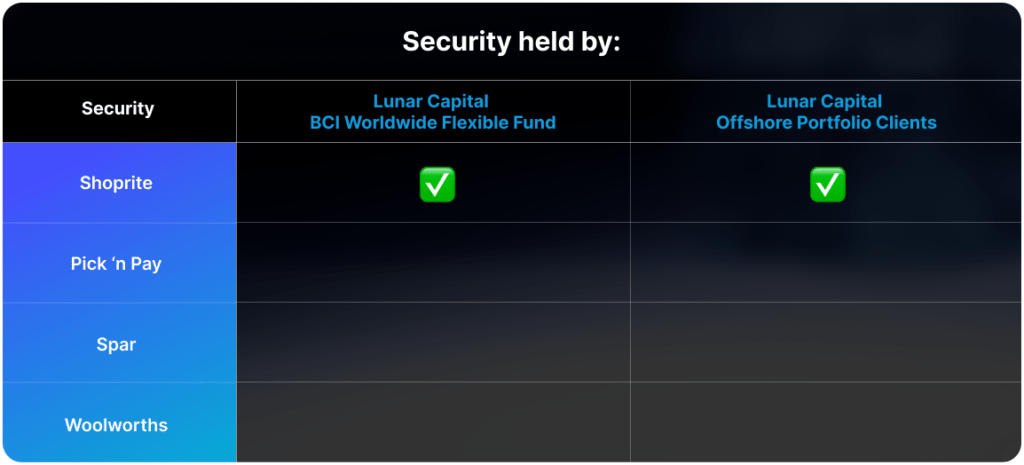
Shoprite is held in the Lunar BCI Worldwide Flexible Fund.

Key Indicators
Index / Fund / Rate
Start of Year
Last Week
This Week
% Change YTD
Index / Fund / Rate
Start of Year
188.33
Last Week
205.68
This Week
206.27
% Change YTD
9.53% Lunar Capital increasesymbol
Index / Fund / Rate
JSE ALSI
Start of Year
76 893
Last Week
72 775
This Week
73 718 Lunar Capital increasesymbol
% Change YTD
-4.13% Lunar Capital stocktake arrow down
Index / Fund / Rate
NASDAQ Composite
Start of Year
15 011
Last Week
16 274
This Week
16 085 Lunar Capital stocktake arrow down
% Change YTD
7.15% Lunar Capital increasesymbol
Index / Fund / Rate
S&P 500
Start of Year
4 770
Last Week
5 137
This Week
5 124 Lunar Capital stocktake arrow down
% Change YTD
7.42% Lunar Capital increasesymbol
Index / Fund / Rate
Prime Lending Rate
Start of Year
11.75%
Last Week
11.75%
This Week
11.75%
% Change YTD
0.00%
Index / Fund / Rate
USD/ZAR
Start of Year
18.30
Last Week
19.09
This Week
18.70 Lunar Capital stocktake arrow down
% Change YTD
2.19% Lunar Capital increasesymbol
Index / Fund / Rate
EUR/ZAR
Start of Year
20.17
Last Week
20.68
This Week
20.45 Lunar Capital stocktake arrow down
% Change YTD
1.39% Lunar Capital increasesymbol
Index / Fund / Rate
Brent Crude ($'barrel)
Start of Year
76.97
Last Week
83.33
This Week
81.82 Lunar Capital stocktake arrow down
% Change YTD
6.30% Lunar Capital increasesymbol
Source: Iress

Click here to access your account to view statements, obtain tax certificates, add or make changes to your investments.

Our email address is: [email protected]

Disclosures
Lunar Capital (Pty) Ltd is a registered Financial Services Provider. FSP (46567)
Read our full Disclosure statement: https://lunarcapital.co.za/disclosures/
Our Privacy Notice: https://lunarcapital.co.za/privacy-policy/
The Lunar BCI Worldwide Flexible Fund Fact Sheet  can be read here.
This stocktake is prepared for the clients of Lunar Capital (Pty) Ltd. This stocktake does not constitute financial advice and is generated for information purposes only.
Shoprite-aholics Read More »

Scroll to Top