A Day out Shopping

A Day out Shopping

Lululemon, the athleisure brand, and Inditex (owner of fashion brands such as ZARA, Oysho, and others) primarily share one similarity: they both make clothes. However, these brands are quite different in terms of their target audience, operational methods, and growth stages.

Lululemon, founded in Vancouver, initially made yoga clothing before expanding into other types of athleisure for various sports. Lululemon has just over 700 stores around the world. Lululemon targets the upper-income segment, focusing on creating high-quality products primarily for women. This approach contrasts with other major athleisure brands like Nike and Adidas. Lululemon also sponsors local trainers and influencers, believing they have a closer connection with their community compared to big stars. Lululemon generally sets trends for each season, attempting to design and produce enough to meet the needs of its client base.

Inditex, on the other hand, operates quite differently. Catering to middle and upper-middle income groups, they have just under 7,300 stores worldwide. Inditex’s biggest brand, ZARA, focuses on offering customers the latest trends. ZARA uses a Just-in-Time vertical integration method. Their scouts attend fashion shows to identify trends, which are then sent to designers. These designs are quickly produced in factories and appear on shelves within 2-3 weeks. Depending on demand, ZARA can easily ramp up or scale down production, producing closer to what is actually needed. This results in there being just enough items in their stores to meet demand.

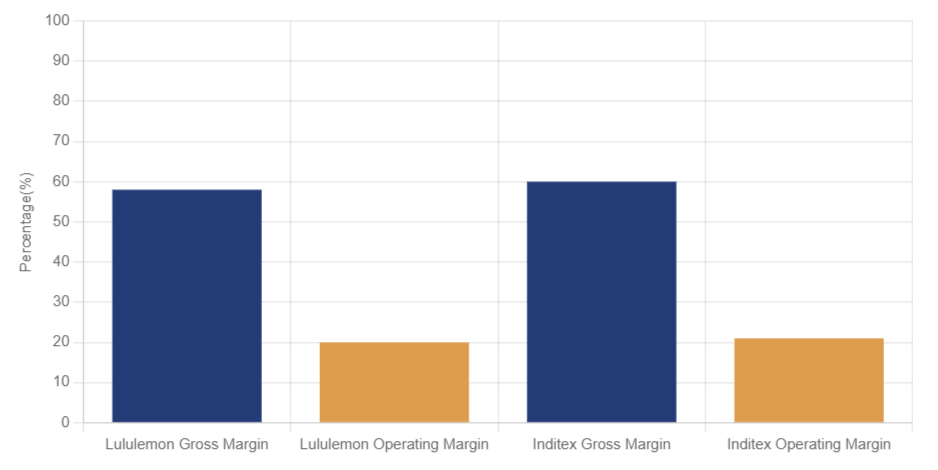
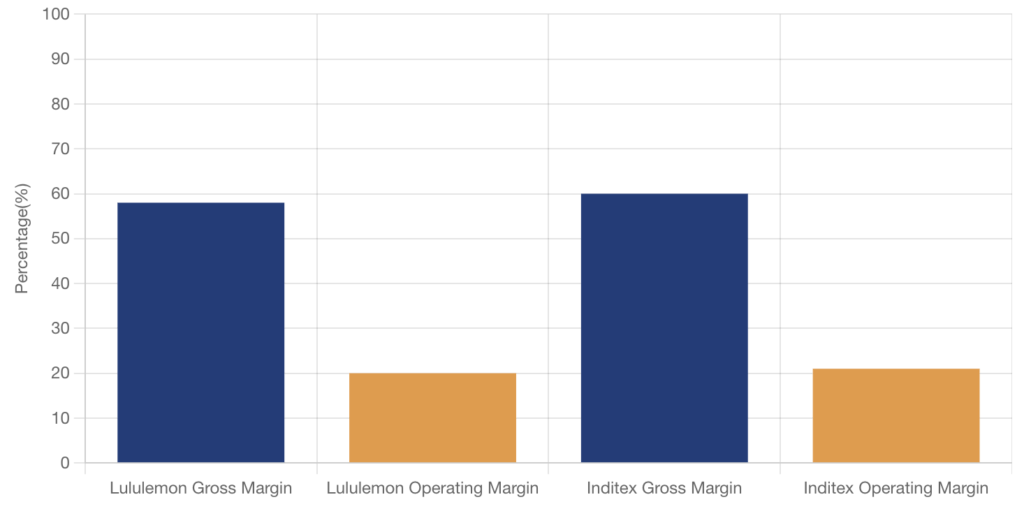
Despite Inditex being just under 4 times bigger than Lululemon in terms of market cap, the graph below shows how similar their gross and operating margins are. The also both have a PE ratio of around 25.

Margin Levels for Lululemon and Inditex
Lunar Capital Lunar
Lunar Capital margin levels

Last week, Lululemon and Inditex released their respective Q1 2024 results. Lululemon’s revenue for the quarter was $2.2 billion, up 10% year-on-year, while operating income was $432.6 million, up 7.7% year-on-year. Lululemon attributed the weakness in their sales growth to a limited colour range in certain women’s products in the US, missing an opportunity to meet demand. Combined with slowing overall demand in the US and Europe, heightened competition in the athleisure space, and the missed opportunity, Lululemon’s stock price has decreased by over 35% year-to-date.

Inditex, on the other hand, had a revenue of €8.2 billion for the quarter, up 7.1% year-on-year. While their operating income was €1.6 billion for the quarter, up 10.3% year-on-year. Inditex expressed that they are planning to spend €1.8 billion, over the next two years, on their supply chain as they look to bolster up their e-commerce offering, while also maintaining their physical presence with their stores.

Security Held In:
Security
Lunar Capital BCI Worldwide Flexible Fund
Lunar Capital Offshore Portfolio Clients
Security
Lunar Capital BCI Worldwide Flexible Fund
Lunar Capital Offshore Portfolio Clients
Security
Lunar Capital BCI Worldwide Flexible Fund
Lunar Capital Offshore Portfolio Clients
Security
Lunar Capital BCI Worldwide Flexible Fund
Lunar Capital Offshore Portfolio Clients
Key Indicators
Index / Fund / Rate
Start of Year
Last Week
This Week
% Change YTD
Index / Fund / Rate
Start of Year
188.33
Last Week
208.29
This Week
214.80
% Change YTD
14.06% Lunar Capital increasesymbol
Index / Fund / Rate
JSE ALSI
Start of Year
76 893
Last Week
76 704
This Week
76 852 Lunar Capital increasesymbol
% Change YTD
-0.05% Lunar Capital stocktake arrow down
Index / Fund / Rate
NASDAQ Composite
Start of Year
15 011
Last Week
16 735
This Week
17 133 Lunar Capital increasesymbol
% Change YTD
14.13% Lunar Capital increasesymbol
Index / Fund / Rate
S&P 500
Start of Year
4 770
Last Week
5 278
This Week
5 347 Lunar Capital increasesymbol
% Change YTD
12.10% Lunar Capital increasesymbol
Index / Fund / Rate
Prime Lending Rate
Start of Year
11.75%
Last Week
11.75%
This Week
11.75%
% Change YTD
0.00%
Index / Fund / Rate
USD/ZAR
Start of Year
18.30
Last Week
18.80
This Week
18.88 Lunar Capital increasesymbol
% Change YTD
3.17% Lunar Capital increasesymbol
Index / Fund / Rate
EUR/ZAR
Start of Year
20.17
Last Week
20.40
This Week
20.42 Lunar Capital increasesymbol
% Change YTD
1.24% Lunar Capital increasesymbol
Index / Fund / Rate
Brent Crude ($'barrel)
Start of Year
76.97
Last Week
81.31
This Week
79.51 Lunar Capital stocktake arrow down
% Change YTD
3.30% Lunar Capital increasesymbol
Source: Iress

Click here to access your account to view statements, obtain tax certificates, add or make changes to your investments.

Our email address is: [email protected]

Disclosures
Lunar Capital (Pty) Ltd is a registered Financial Services Provider. FSP (46567)
Read our full Disclosure statement: https://lunarcapital.co.za/disclosures/
Our Privacy Notice: https://lunarcapital.co.za/privacy-policy/
The Lunar BCI Worldwide Flexible Fund Fact Sheet  can be read here.
This stocktake is prepared for the clients of Lunar Capital (Pty) Ltd. This stocktake does not constitute financial advice and is generated for information purposes only.

Share article

Latest Posts

With a Side of Chips, Please
What was the story behind ASML and TSMC's recent results.
JP Mor-Gains
JP Mor-Gains
How is JP Morgan navigating an increasingly complex environment.
AI: The Energy Saga
AI: The Energy Saga
How are businesses dealing with AI's increasing energy demand?

Lunar Capital
on Eastwave Radio

Every Wednesday, at 07h45, Sabir chats with Nazia from Eastwave Radio (92.2 fm, live stream on
www.eastwave.co.za) on investing and the markets.

eastwave-radio
Scroll to Top